Common Size Income Statement | What is It? & How to Create?

Are you eager to gain a deeper understanding of your company’s financial health? Look no further! This article will walk you through everything you need to know about the common size income statement. From defining what it is to how to prepare one, we’ve got you covered.
You’ll learn its various applications, such as profit analysis, historical trend evaluation, and competitive comparisons. Additionally, we’ll delve into vertical and horizontal analysis, providing clear examples for each. By the end, you’ll be well-equipped to make informed financial decisions. Ready to unlock the power of financial analysis? Dive in!
What Does an Average Income Statement Size Mean?
A common-size income statement is a financial tool that presents each item as a percentage of total revenue. This format is particularly useful for comparing the financial performance of companies of different sizes or analyzing a single company’s performance over time.

By converting absolute numbers into percentages, stakeholders can easily assess how much of each dollar earned is allocated to costs, expenses, and profits.
In a common-size income statement, total revenue is set at 100%, and every other line item is expressed as a portion of this total.
For instance, if a company has a total revenue of $1,000,000 and its cost of goods sold (COGS) is $400,000, the COGS would be shown as 40% of total revenue. This makes it simpler to identify trends, efficiencies, and areas of concern.
Using this method, you can quickly identify which expenses take up the largest share of revenue and how profitable the company is.
It also allows for easy comparison with competitors, as the percentages can be directly compared regardless of the absolute dollar amounts. This level of insight is crucial for making informed financial decisions and strategizing for future growth.
How to Prepare a Common-Size Income Statement?
Creating a common-size income statement can seem overwhelming, but breaking it down into steps simplifies the process.

Here’s how you can do it:
- Gather Financial Data: Collect the income statement for the period you want to analyze. Ensure all necessary figures are included.
- Identify Total Revenue: Find the total revenue, which will serve as the base figure, representing 100% of your analysis.
- Calculate Percentages: For each line item on the income statement, divide the amount by the total revenue and multiply by 100. This converts each line item into a percentage of total revenue.
- Format the Statement: Present your data in a structured format. List each item with its corresponding percentage next to it.
- Analyze the Results: Look at the percentages to understand the allocation of revenue. Compare these with previous periods or competitors to gain insights into financial performance and efficiency.
By following these steps, you can easily prepare a common-size income statement that provides valuable financial insights.
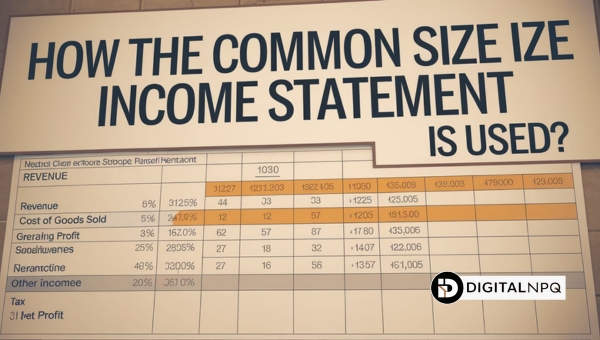
How the Common Size Income Statement Is Used?
A common-size income statement is a powerful tool for various financial analyses. It helps in understanding profit dynamics, examining historical data, and comparing a company’s performance with its competitors. Let’s explore how it’s utilized in these key areas.

Profit Analysis
Profit analysis using a common-size income statement involves examining the percentages of revenue allocated to different expenses. By converting each line item into a percentage of total revenue, it becomes easier to see how much of each dollar earned goes to costs and how much remains as profit.
This method helps in identifying trends in gross margins and operating margins, making it clear where a company is gaining or losing efficiency.
Historical Trends
To compare historical financial data, a common-size income statement is invaluable. By looking at percentages rather than absolute numbers, you can easily track changes in expense and revenue allocation over time.
This approach highlights shifts in a company’s financial structure and operational priorities, revealing long-term trends that might be missed in a traditional income statement.
Competitive Comparisons
Companies often use common-size income statements to benchmark their performance against competitors. By comparing the percentage allocations of revenues and expenses, businesses can identify areas where they are outperforming or lagging behind their peers.
This analysis provides insights into cost management practices and pricing strategies, helping companies to refine their operational tactics.
Also Read: PlayStation Lawsuit Claim: What You Need to Know
Comparing Horizontal and Vertical Analysis
Understanding the differences between vertical and horizontal analysis is essential for anyone looking to delve deeper into financial statements.
These methods offer unique insights into a company’s financial health and performance over time or within a specific period.
Vertical Analysis
Vertical analysis involves presenting each line item in a financial statement as a percentage of a base figure within the same period. Typically, in an income statement, each line item is shown as a percentage of total revenue.
This method makes it easier to see the relative size of each expense and profit item in relation to total revenue. For example, if total revenue is $200,000 and the cost of goods sold (COGS) is $80,000, COGS would be 40% of total revenue.
This approach helps in comparing financial statements of different sizes and spotting trends in how revenue is allocated.
Horizontal Analysis
Horizontal analysis, on the other hand, compares specific financial data across multiple periods. It focuses on identifying growth rates, declines, and trends over time. For instance, if a company’s revenue increased from $150,000 to $180,000 over a year, horizontal analysis would highlight this 20% growth.
This method is particularly useful for assessing how a company’s financial situation evolves, providing insights into performance trends and future projections. By comparing the same line items over different periods, stakeholders can make more informed decisions about the company’s financial health.
Also Read: Average Philippine Wage: Key Insights You Must Know
Examples of Common Size Income Statements
When it comes to understanding a company’s financial performance, common size income statements offer clarity. By converting line items into percentages of total revenue, these statements simplify comparison and analysis. Let’s explore how vertical and horizontal analyses work in this format.
Vertical Analysis Example
In vertical analysis, each item on the income statement is shown as a percentage of total revenue. For instance, consider Company A with total revenue of $250,000:
- Revenue: 100%
- Cost of Goods Sold (COGS): 50% ($125,000)
- Operating Expenses: 30% ($75,000)
- Net Income: 10% ($25,000)
This approach makes it easy to see how much of each dollar earned is spent on various costs, helping stakeholders quickly assess financial health.
Horizontal Analysis Example
Horizontal analysis involves comparing financial data across different periods. For example, if Company B had total revenue of $200,000 last year and $240,000 this year, the revenue growth is 20%. Similarly, if COGS increased from $80,000 to $96,000, the analysis reveals whether the cost structure is stable:
- Revenue Growth: 20% increase
- COGS Growth: 20% increase
This method helps identify trends and changes over time, providing insights into whether a company is improving or facing challenges.
FAQs
What is a common-size income statement quizlet?
A common-size income statement quizlet is a study tool that helps students learn the concept of a common-size income statement. It represents each line item as a percentage of total revenue to facilitate easier comparisons.
How to make a common-size balance sheet?
To make a common-size balance sheet, convert each line item into a percentage of total assets. This method simplifies comparisons across different time periods or companies by standardizing the data.
Which of the following is a red flag in financial analysis?
A significant and unexplained increase in expenses is a red flag in financial analysis. It may indicate potential issues with cost management or inefficiencies within the company.
Conclusion
A common size income statement is an essential tool for analyzing a company’s financial health. By presenting each line item as a percentage of total revenue, it allows for easy comparison across different time periods and companies.
This aids in better understanding profitability, cost management, and overall financial performance. Whether you’re assessing trends, comparing competitors, or simply trying to get a clearer picture of financial operations, a common-size income statement is invaluable.
If you found this information helpful, be sure to explore more insightful articles on our site to deepen your financial knowledge!
